Investor Data Room

Due Diligence
Documents.

Full transparency. Every document verified. Click to access executed leases, financials, borrower credentials, and project scope.

Active Acquisition — Under Contract
Tampa, FL 33614 · Drew Park Industrial Corridor · City of Tampa CRA Designated

4214 W Virginia
Ave Industrial

A precision value-add repositioning — acquired below replacement cost in Tampa's most supply-constrained airport-proximate submarket, with verified in-place income, documented forced-appreciation levers, and a clear institutional exit.

Purchase Price$3,750,000
Building SF45,560 SF
All-In Basis$5,250,000
In-Place NOI$169,313
Proforma NOI$848,637
Est. Completed Value$13,055,538
Repositioning Vision

From Underperforming
to Institutional-Grade.

The vision is clear — transform a 45,560 SF legacy industrial asset into a modern, fully leased multi-tenant facility positioned for institutional acquisition. Exterior upgrades include new metal paneling, fresh paint, updated signage, and improved curb appeal across all street-facing elevations. Interior repositioning targets Class A warehouse and flex finishes at $25.42/SF Full Service Gross + 8% CAM ($27.46/SF effective) — a standard Drew Park institutional buyers are actively pursuing.
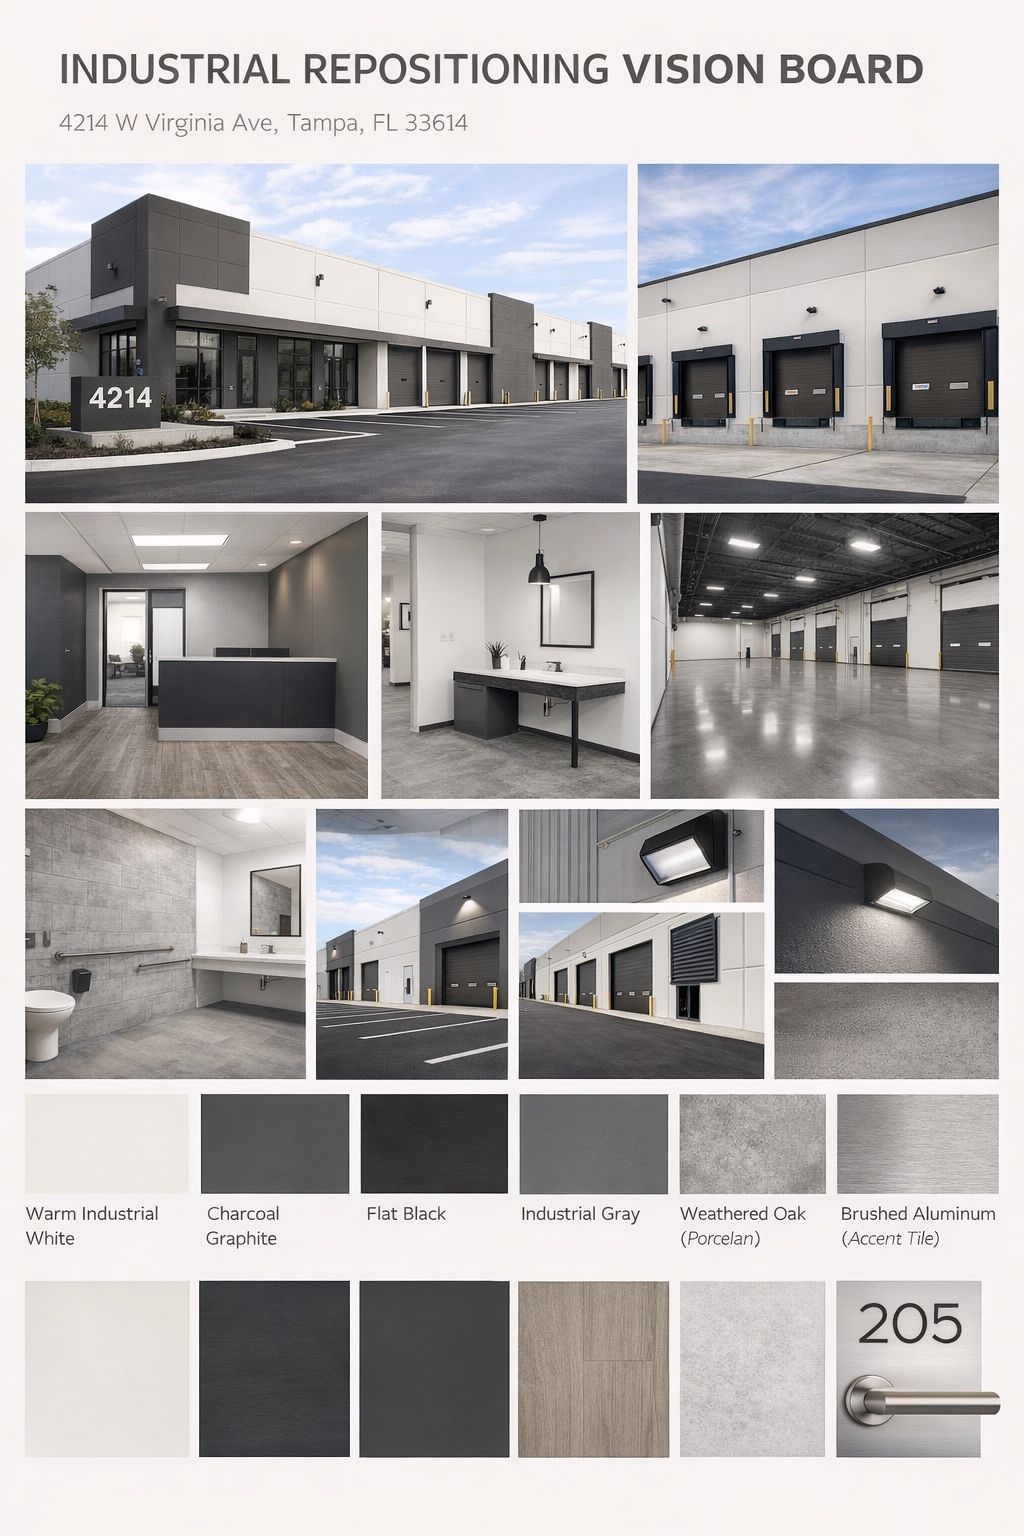
4214 W Virginia Ave — Industrial Repositioning Vision Board
INDUSTRIAL
Deal Presentation

The Full
Investment Thesis.

Full underwriting, verified rent roll, market analysis, and repositioning strategy — presented by Tampa Development Group LLC, a Suarez Global Ventures Company. Principal: Javier A. Suarez.

$82.31/SF basis vs. $157+ as-is stabilized market value/SF
4 Verified Tenants — $256,200 annual in-place rent on executed leases
35,060 SF Vacancy Upside — $525,900/yr at $15/SF market rents
All Star Arbitrage — 25,000 SF at $3.60/SF vacating Apr 2026; market is $15/SF+
Drew Park CRA — City of Tampa active municipal incentive zone
70% LTC Bridge + $1.2M equity — Full CapEx funded, lender-clean structure
Request Investor Access
Interactive Investor Presentation — Tampa Development Group LLC
Open Full Screen
Deal Snapshot

Numbers That
Speak For Themselves.

$3.75M
Contract Price
Below Market Comps
45,560
Total Building SF
1.9 Acre Lot · Tampa FL
4.52%
In-Place Cap Rate
On Purchase Price
16.8%
As-Is Stabilized Cap Rate
Yield on Purchase Price
$5.25M
All-In Project Basis
Purchase + $1.5M CapEx
$13.1M
Est. Completed Value
@ 6.5% Exit Cap Rate
40.2%
Cost-to-Value Ratio
Embedded Equity at Purchase
1.39x
DSCR at Stabilization
$237K Annual Free Cash Flow
Current — Verified
In-Place NOI
$169,313
Revenue: $256,200 (4 tenants, executed leases)
Op. Expenses: ($86,887) verified via county records
Occupancy: 77.9% · 35,500 SF leased
In-Place Cap Rate: 4.52% on $3.75M
Proforma — Post Repositioning
Stabilized NOI @ $25.42/SF FSG + 8% CAM
$848,637
Revenue: $1,173,942 ($25.42/SF base + 8% CAM + parking)
Op. Expenses: ($325,305) proforma
Yield on Cost: 16.2% on $5.25M all-in basis
Exit Value: $13,055,538 @ 6.5% cap
Verified Rent Roll

Existing Tenants &
Vacancy Opportunity.

Four active tenants generating $256,200 annually on executed leases and license agreements — all verified via executed documents, county records, and utility bills. Three vacant spaces represent $525,900 in annualized upside at $15/SF market rates.

TenantSuiteSFLease TypeMonthly RentAnnual Rent$/SF/YrExpiresStatus
All Star Paper GoodsUnit 125,000Modified Gross$7,500$90,000$3.60Month-to-MonthVacating Apr 2026
Kitchen Cabinet & Stone Inc.Unit 24,000NNN$4,000$48,000$12.00Jul 31, 2026Active — Verified
Kitchen Cabinet & Stone Inc.Unit 34,200NNN$4,200$50,400$12.00Jul 31, 2026Active — Verified
Kitchen Cabinet & Stone Inc.Unit 4700NNN$650$7,800$11.14Jul 31, 2026Active — Verified
Metro Diner LLCUnit 51,600NNN$2,000$24,000$15.00Month-to-MonthActive
Skyline Limousine of Tampa BayUnit 6 (Outdoor Parking)License Agreement$3,000$36,000Dec 31, 2025Active
TOTAL IN-PLACE35,500 SF$21,350/mo$256,200/yr
VAC-1
Unidentified Space(s)
6,060 SF
$90,900/yr potential · $15/SF · As-is, non-renovated
VAC-2
Corner Loft Unit
4,000 SF
$60,000/yr potential · $15/SF · Minor cleanup, previously Kennedy South Painting
VAC-3
All Star Paper Goods
25,000 SF
$375,000/yr potential · $15/SF · Vacating April 2026 — largest single upside lever
Total Vacancy Upside
$525,900
35,060 SF · Annually at $15/SF market
CAPITAL
Capital Structure

Conservative
Leverage. Full Protection.

70% LTC senior bridge loan funds the acquisition. 100% of CapEx is separately funded through the rehab draw. Total equity requirement of ~$1.2M — sourced from the liquidity partner and internal JV capital — keeps sponsor alignment high and lender risk low.

Senior Bridge — Acquisition (70% LTC)$2,625,000
Senior Bridge — Rehab (100% Funded)$1,500,000
Equity — Liquidity Partner + JV$1,200,000
Sponsorship Structure — Suarez Global Ventures LLC

Operating Sponsor (Javier A. Suarez) — Signs all loan documents, provides institutional track record and REO portfolio, oversees complete execution and leasing strategy.

Liquidity Partner — LLC member (not a silent contributor). Demonstrates $1.0M–$1.5M+ verified liquidity via bank statements. Limited operational involvement. Structure eliminates lender ambiguity around sponsorship, personal guarantees, and liquidity requirements.

Sources of Funds
~$5,325,000
Sr. Bridge — Acquisition~$2,625,000
Sr. Bridge — Rehab~$1,500,000
Closing Costs & Reserves~$75,000
Equity Investment~$1,200,000
Uses of Funds
~$5,325,000
Property Acquisition~$3,750,000
Repositioning / CapEx~$1,500,000
Closing Costs & Reserves~$75,000
Verified Operating Expenses (In-Place)
Real Estate Taxes (Hillsborough County)$45,486/yr
Insurance (RE Investment Quote)$20,976/yr
City of Tampa Water/Sewer$7,615/yr
Management Fee (5% of gross income)$12,810/yr
Total Owner-Paid OpEx$86,887/yr
THESIS
Investment Thesis

Basis-Light.
Asset-Heavy.
Execution-Driven.

"This is an asset-heavy, basis-light industrial repositioning acquired well below market, with conservative leverage, strong in-place fundamentals, and clear forced-appreciation levers. Even under conservative underwriting, stabilized value materially exceeds total cost."

Explore Partnership Options
01
Below-Market Acquisition Basis

Contract price of $3.75M ($82.31/SF) vs. as-is stabilized market value of $7.18M+ ($157.68/SF). Buying at a $3.43M discount to as-is market value before any renovation upside. Embedded equity protection from day one.

02
Lease Rollover Arbitrage — All Star

All Star Paper Goods holds 25,000 SF at $3.60/SF (Modified Gross) on a month-to-month lease, vacating April 2026. Tampa market rate is $15/SF+. Re-leasing this single space at market adds $283,500 in annual NOI — documented, not speculative.

03
Vacancy Monetization — 35,060 SF

10,060 SF currently vacant (VAC-1 unidentified space + VAC-2 Corner Loft). Combined with All Star's departure, total vacancy represents $525,900 in annual upside at $15/SF as-is rents. Repositioned at $25.42/SF Full Service Gross + 8% CAM ($27.46/SF effective), potential gross revenue reaches $1,173,942.

04
Conservative Capital Structure

70% LTC senior bridge with 100% rehab funding provides downside protection while maximizing equity returns. $1.2M equity requirement keeps sponsor alignment strong. Lender-clean structure via Suarez Global Ventures LLC designed for fast approvals.

05
Flexible Exit — Dual Pathways

Sell stabilized to institutional buyer (Prologis, Basis Industrial, 1031 exchange buyers) at 6.5% cap → $13,055,538 estimated value. Or refinance to permanent at $8.5M loan, locking $237,045 free cash flow annually at 1.39x DSCR. Both pathways supported by current market data.

Exit Valuation & Returns

The Path to
$13,055,538.

Full Lease-Up — Proforma Rent Roll41,440 SF @ $25.42/SF FSG + 8% CAM + $36,000 parking
$1,173,942Gross Revenue
Less Proforma Operating ExpensesTaxes · Insurance · Utilities · Mgmt · CAM · Marketing · Vacancy
($325,305)Total ProForma OpEx
Stabilized Net Operating Income
$848,637Proforma NOI
Apply Conservative 6.5% Cap RateInstitutional pricing for airport-proximate Tampa industrial
$13,055,538Estimated Completed Value
Stabilized NOI Range
$710K–$850K
Conservative ARV Range
$10.9M–$13.1M
Debt Service Analysis

Stabilized
Cash Flow.

At stabilization, the permanent loan of $8.5M (65% LTV) delivers healthy free cash flow with a DSCR of 1.39x — well above typical lender minimums — positioning the asset for either a clean institutional sale or a long-term cash-flowing hold.

$8.5M
Permanent Loan
@ 6% Interest Rate
1.39x
DSCR at
Full Stabilization
$237K
Annual Free
Cash Flow
Institutional Buyer Universe
REITs & Institutions: Prologis, Link Logistics (Blackstone), Generation Income Properties (Tampa-based), Nuveen, Transwestern
Private Equity: Basis Industrial (Delray Beach), Mangrove Equity Partners, Ballast Point Ventures, Osceola Capital
1031 Exchange Buyers: Tampa's 6.5% YOY rent growth + airport proximity = premium exchange target
Brokerage Execution: Cushman & Wakefield, CBRE, Colliers — Tampa industrial specialists
TAMPA
Market Context

Drew Park & Tampa Bay:
A Region on the Rise.

Institutional capital is actively flowing into Tampa's fastest-growing industrial corridor — backed by billions in public infrastructure investment, a $1.5B TPA expansion, and unprecedented regional economic tailwinds.

Drew Park — Strategic Location
Minutes from Tampa International Airport (TPA) — irreplaceable airport-proximate advantage for logistics and distribution
Direct access to I-275 and Veterans Expressway — regional connectivity for last-mile operators
City of Tampa CRA Designated — active municipal incentives for industrial and commercial redevelopment, reducing execution risk
1.5 sq. miles of established industrial infrastructure — warehouses, flex spaces, and distribution centers
Small-bay vacancy: ~3% — tightest segment in the Tampa market; institutional buyers actively targeting this corridor
Tampa Industrial Fundamentals
Overall vacancy: 6.8–8.5% — tight supply with continued positive net absorption
Market rents: $9+/PSF with 6.5% YOY growth; our proforma targets $25.42/SF FSG + 8% CAM
$727M in Tampa industrial sales YTD through Q3 2025 — Q3 alone: $337M
Premium stabilized assets trading in the low-6% cap range — our 6.5% target is positioned for upward valuation pressure
Industrial loan originations Q2 2025: +102% QoQ — lenders aggressively deploying capital into industrial
TPA Expansion — $1.5B Direct Catalyst
Airside D: $1.5B terminal — 16 gates opening 2028; targeting 35M annual passengers by 2037
Enhanced air cargo and logistics infrastructure — fueling 3PL demand in airport-proximate Drew Park
OBBBA (Public Law 119-21): $4.75B for Air Traffic Control modernization directly supporting TPA operations
100% Bonus Depreciation for qualified property placed in service after Dec 31, 2025 — reduces effective CapEx cost 15–25%
Florida & Tampa Bay Economy
Florida GDP: $1.5 trillion — 2.5–3.0% growth outpacing national average; no state income tax
Population: 23.75M+, adding 1.4M+ residents through 2030 — driving sustained last-mile logistics demand
Tampa Bay: #2 fastest-growing mid-sized U.S. economy — Gross Metropolitan Product up 43%
Port Tampa Bay economic impact: $34.6B, supporting 192,000+ jobs — directly fueling cargo demand near Drew Park
Transformative projects: Howard Frankland Bridge (2026), Westshore Interchange (I-275/SR-60), $1B+ Water Street Tampa
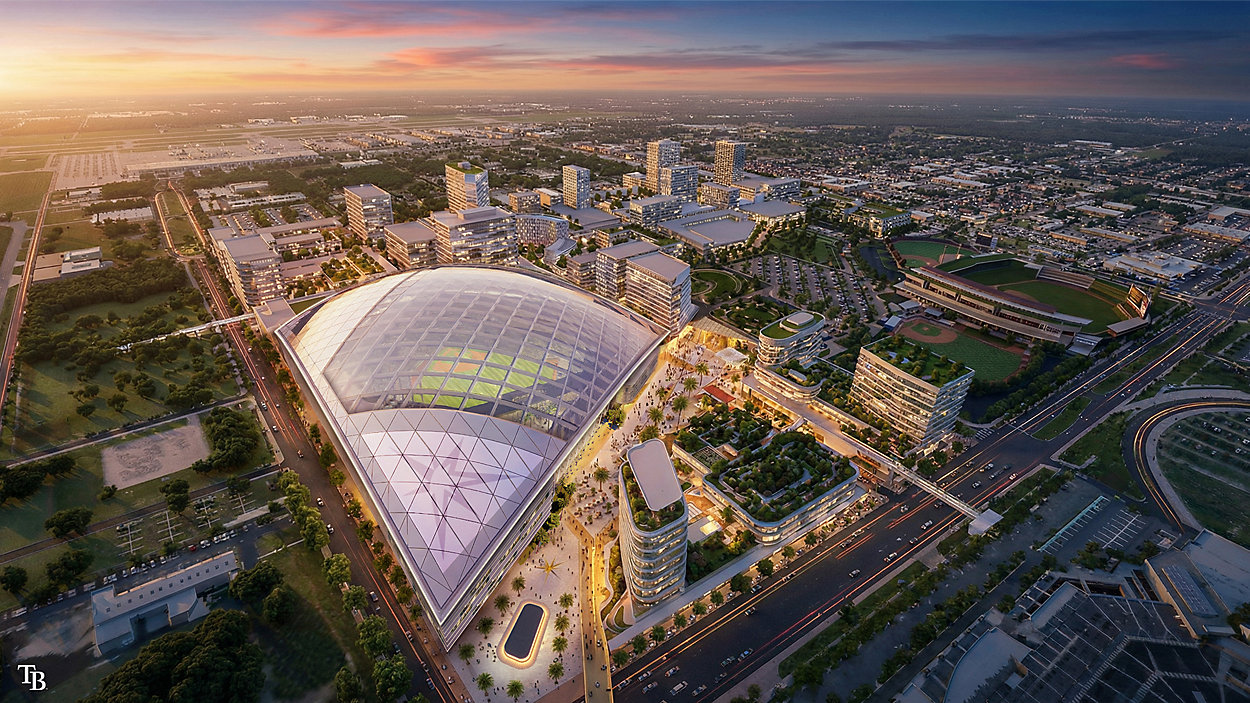
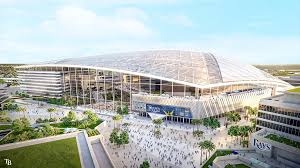
Opening Day 2029 Tampa Bay Rays New Ballpark Rendering
Less Than 1 Block Away Rays Park Mixed-Use District
Proximity Catalyst

A $2.3 Billion Stadium
Less Than a Block Away.

The Tampa Bay Rays are building their permanent home — a state-of-the-art ballpark and mixed-use district on the Westshore/Dale Mabry corridor. 4214 W Virginia Ave sits in the direct path of the largest development Tampa Bay has ever seen. This is not speculative — it has the backing of Florida's Governor, the MLB Commissioner, Hillsborough County, and every major sports franchise in the region.

$2.3B
Ballpark & District
Total Cost
$34B
30-Year Projected
Economic Impact
10M+
Annual Visitors
At Full Build-Out
11,900
Permanent New
Jobs Created
Location & Design
The 130-acre site sits at Dale Mabry Highway & West Tampa Bay Boulevard — directly across from Raymond James Stadium and adjacent to Steinbrenner Field. The district is divided into four zones: Champions Quarter (the $2.3B domed stadium seating ~31,000), Innovation Edge (rebuilt Hillsborough College campus), The Row (retail and dining spine), and The Canopy (green space, restaurants, and residential). Designed by Populous and Gensler — the world's leading sports architecture firms.
Funding & Political Support
The Rays cover 50% of construction + 100% of all cost overruns. The remaining ~$467M comes from Hillsborough County's existing Community Investment Tax. Gov. DeSantis facilitated the state land transfer. MLB Commissioner Manfred, Mayor Castor, the Hillsborough County Commission (unanimous vote), the Buccaneers, Lightning, Yankees, and Tampa International Airport are all formal stakeholders. Binding government votes expected April 1–2, 2026.
Economic Impact
An independent analysis by RCLCO projects $34 billion in total economic impact over 30 years, with 10 million annual visitors comparable to a major U.S. theme park. Commissioner Hagan estimates the full development beyond the stadium at $8–$10 billion. The mixed-use development is 100% privately financed beyond the stadium itself — creating a self-reinforcing stream of tax revenue that funds schools, infrastructure, and public services.
How We Got Here
In fall 2024, Hurricane Milton damaged Tropicana Field's roof. During 2025, the Rays played at Steinbrenner Field. In March 2025, the Rays exited their previous $1.3B deal in St. Pete after Pinellas County commissioners delayed bond approval. That collapse pivoted the team entirely to Tampa/Hillsborough County. Gov. DeSantis and the Florida Cabinet transferred 22 acres of state land on Feb. 24, 2026, with a five-year use condition requiring construction to begin within that window.
Development Timeline
2026
Rays return to Tropicana Field. Binding votes April 1–2. Groundbreaking targeted July.
2027
Active stadium construction. Mixed-use district development begins.
2028
Final season at Tropicana Field. Construction acceleration.
2029
Opening Day at Rays Park. 31,000-seat domed stadium operational.
2030+
Full district buildout. 10M+ visitors. $34B economic engine at maturity.
The Proven Playbook — Battery Atlanta Comparison
The Rays have explicitly modeled Rays Park after The Battery Atlanta — the mixed-use district built around Truist Park (Atlanta Braves) in Cobb County, GA. That project is now the most-studied example of stadium-led economic development in the country. The surrounding area saw a broader halo of approximately $4.5 billion in increased property values from 2013 to 2018 alone.
$5M → $736MBattery Atlanta Taxable
Property Values (2014–2022)
$38M / YearAnnual Tax Revenue
to County, State & Schools
10M VisitorsRecord Year in 2022 — Net
Positive for Cobb County Taxpayers
Investor Relations

Ready to Move
With Conviction?

This deal is open to accredited investors and strategic capital partners. We are actively seeking a liquidity partner with $1.0M–$1.5M+ verified liquidity to join as an LLC member in Suarez Global Ventures LLC. Request the full data room — including executed leases, county tax records, insurance quotes, and utility verification — and schedule a call with Javier A. Suarez.